Are you curious about the hidden patterns behind Twitter’s explosive growth? Twitter Statistics reveal fascinating insights into how people interact, what trends take off, and how businesses can leverage the platform to boost their success.
In this article, System SocialZ will uncover the most compelling Twitter statistics that can transform the way you approach the platform. From surprising user demographics to eye-opening engagement rates and business performance metrics, these numbers will give you an edge in the crowded digital landscape. Whether you’re a marketer, influencer, or just curious about how Twitter is evolving, these insights will reshape the way you think about tweeting.
What are Twitter Statistics?
Twitter statistics refer to the collection and analysis of data related to user activity and platform performance on Twitter. These stats encompass a wide range of metrics, from how many people use Twitter globally, to how often they tweet, what content they engage with, and how businesses are leveraging the platform for marketing. Some of the most critical statistics include the number of daily active users, tweet engagement rates, follower growth, demographics (like age, gender, and location), as well as metrics that measure the success of Twitter ads.
By examining these statistics, users can gain valuable insights into Twitter’s role in shaping online conversations, its influence in the digital marketing space, and how to optimize their strategies for better results. For instance, marketers can use this data to target their ads more effectively or schedule posts during peak engagement hours. Likewise, businesses can track trends to stay relevant in their industries.
Importance of Twitter Statistics in 2024
Tracking Twitter statistics is essential for businesses and marketers to understand the platform’s reach, audience behavior, and advertising potential. Here’s why these numbers matter:
Massive User Base: With over 500 million monthly active users and 200 million daily users, Twitter is still a key platform for reaching a large, engaged audience.
Key Demographics: Twitter is most popular among users aged 25-35, a highly influential age group for marketing. Knowing your audience helps tailor content and advertising.
Global Reach: Twitter reaches 13% of all internet users, making it an important platform for businesses aiming to expand globally.
Gender Balance: Men use Twitter more than women globally. Men account for approximately 62% of Twitter’s user base, compared to 38% for women. This demographic data can guide targeted advertising strategies.
Advertising Revenue: Twitter’s $3 billion in ad revenue shows the platform’s strength in delivering targeted ads, making it a valuable tool for marketers.
Lean Operation: With just 1,000 employees, Twitter operates efficiently, showing its focus on innovation and platform growth.
Understanding these statistics allows businesses to make informed decisions, optimize their strategies, and maximize results on Twitter.
Why Twitter Statistics Matter?
Knowing these important Twitter statistics can help you better navigate the platform, whether you’re a marketer, business owner, or content creator. Here’s why they matter:
Optimizing Content for Your Audience
Understanding the demographics of Twitter users helps you craft content that resonates with your target audience. For example, if your brand targets Millennials (aged 25-35), knowing this is the largest group on Twitter helps you shape your messaging and tone to engage them better.
Timing Your Engagement
With millions of users active every day, Twitter is perfect for real-time marketing. Knowing when users are most active allows you to strategically time your tweets, improving engagement and visibility. This is especially crucial during big events, trending hashtags, or important conversations.
Maximizing Advertising ROI
Twitter’s multi-billion-dollar advertising industry shows the power of its ad products. By leveraging these tools and targeting your audience based on demographics, behavior, and interests, you can maximize the return on your ad spend. Real-time bidding and ad analytics further allow you to adjust your campaigns on the go, making Twitter a dynamic platform for advertisers.
Expanding Global Influence
With Twitter reaching 13% of global internet users, the platform offers unparalleled access to a worldwide audience. Businesses with global aspirations can use Twitter to break into new markets, engage with culturally diverse audiences, and spread their messages internationally.
In 2024, Twitter statistics offer crucial insights that empower brands, marketers, and influencers to make data-driven decisions. By staying informed and leveraging this data, you can improve your reach, grow your audience, and drive business results on Twitter.
How to View Account Statistics on Twitter?
Viewing your account statistics on Twitter is essential for understanding your performance and engagement levels. There are two main methods to access Twitter statistics:
Using Twitter’s Built-In Analytics Tool
The built-in Twitter Analytics tool is available for all accounts and provides a comprehensive overview of your account’s performance. To access it:
- Click on your profile photo in the upper right corner of the Twitter interface.
- Select Analytics from the dropdown menu.
Once you’re in the Analytics dashboard, you’ll find several key sections:
Home: This section provides a general summary of your account over the last 28 days, including:
- Tweet Count: The total number of tweets posted.
- Tweet Impressions: The non-unique views of your tweets, indicating overall popularity.
- Mentions: How often your account is mentioned in other tweets.
- New Followers: Highlights the follower who gained the most new followers during the period.
Tweets: Here, you can view detailed analytics for all tweets, including:
- Impressions, engagements, and engagement rates over the last 28 days.
- A CSV export option for deeper analysis of your tweet performance.
Audience: This section provides demographic insights about your followers, including:
- Age, gender, location, and interests.
- Popular events and topics being discussed among your followers, categorized into Events, Sports, Movies, and Recurring Trends.
Using Third-Party Tools
For a broader analysis, you can utilize Third-Party tools, which allows you to view statistics not only for your account but also for competitors or other public profiles. These tools typically provide additional insights such as engagement rates, post performance, and historical data that can help you refine your content strategy.
By regularly checking your Twitter account statistics through the built-in Analytics tool or third-party platforms, you can gain valuable insights into your performance and audience engagement. This knowledge empowers you to tailor your content, optimize your posting strategy, and ultimately enhance your presence on Twitter.
How to Use Twitter Statistics?
Leveraging Twitter statistics is essential for optimizing your content strategy and understanding your audience. Here’s how to make the most of the data available to you:
Know Your Audience
Understanding the demographics of your followers—such as their age, gender, location, and interests—is crucial. Twitter Analytics provides detailed insights that help you create a comprehensive profile of your audience.
Knowing your audience allows you to tailor your content to their preferences. For instance, if your followers predominantly fall within a certain age group or geographic location, you can adjust your messaging, topics, and posting times accordingly.
Identify Content Preferences
Use Twitter’s analytics to analyze how different types of content perform. Pay attention to metrics like:
Engagement Rates: Which tweets receive the most likes, retweets, or replies?
Content Formats: Are your followers responding better to images, videos, or text-based tweets?
Topics of Interest: What subjects are generating the most discussions?
Understanding these factors helps you focus on content that resonates with your audience, whether it’s humorous tweets, informative threads, or interactive polls.
Optimize Posting Times
Analyze the data to determine when your followers are most active on Twitter. The engagement rates for your tweets will likely be higher during these peak times, leading to greater visibility and interaction.
Best Practices: Use the analytics data to schedule your tweets during these high-traffic times to maximize reach and engagement. This strategic timing can significantly enhance the performance of your posts.
Analyze Competitor Profiles
To gain a broader understanding of your niche, consider analyzing competitor accounts. While Twitter’s built-in analytics only provides insights for your account, you can use third-party tools to evaluate other profiles. You can read more about Twitter Analytics also Tools Analytics at System SocialZ.
Adjust Your Strategy
Based on the insights gained from your analytics, be ready to adjust your content strategy.
Trial and Error: If you notice certain types of content or posting times perform better, incorporate those insights into your overall strategy. Continuously monitor the results to ensure ongoing improvement.
Using Twitter statistics effectively can significantly enhance your engagement and growth on the platform. By understanding your audience, identifying content preferences, optimizing posting times, and analyzing competitors, you can develop a tailored strategy that resonates with your followers. Regularly reviewing these metrics ensures you stay relevant and effective in your Twitter marketing efforts.
General Twitter Statistics
In the rapidly evolving landscape of social media, understanding the current state of X (Twitter) is essential for users and marketers alike. Here are some key statistics that highlight the platform’s relevance and user sentiment as of 2024:
Awareness of Name Change
Approximately 70% of U.S. adults are aware of Twitter’s name change to X. Despite this transition, many discussions still reference the original name for clarity. This linguistic shift poses challenges for communication about the platform, necessitating the inclusion of both names in conversations and reports.
User Sentiment on Name Change
Among Twitter users, 43% believe that changing the name to X was a mistake. This sentiment reflects a divide among the user base regarding the new branding. The name change complicates discussions about the platform, with many reports opting for phrases like “X” to ensure clarity.
Most Followed Account
The most followed account on X is @ElonMusk, who has amassed 179.2 million followers since acquiring the platform. Musk surpassed former President Barack Obama, who has 131.9 million followers. Other notable accounts in the top five include Justin Bieber, Cristiano Ronaldo, and Rihanna, showcasing the platform’s appeal to high-profile celebrities.
Public Perception of X
Only 40% of individuals have a positive opinion of X, highlighting the divisive nature of Musk’s ownership. Currently, 26% of the public expresses dislike for the platform, while 19% hold neutral views. This mixed sentiment indicates that the platform’s reputation is still in flux, influenced by ongoing changes and user experiences.
Popularity Among Social Media Platforms
According to the Pew Research Center, X ranks as the 9th most popular social platform in the United States, with 22% of Americans reporting that they use the platform. In contrast, Facebook is used by 68% and Instagram by 47% of Americans. This statistic suggests that while X is not the primary focus for many marketers, understanding its specific audience is crucial for effective marketing strategies.
Target Market Considerations
Despite its lower overall popularity, it is vital for marketers to determine if their specific target audience actively uses X. If the intended market engages on the platform, investing time and resources there can still yield valuable results, regardless of its standing among other social networks.
These general statistics about X (Twitter) provide insight into the platform’s current landscape, user opinions, and its relevance in the social media sphere. As brands and marketers navigate these dynamics, understanding both user sentiment and demographic engagement is crucial for developing effective strategies.
Twitter (X) Usage Statistics That Prove the Platform’s Impact
As of 2024, Twitter (X) continues to showcase its significance in the social media landscape. Here are key statistics that illustrate the platform’s ongoing influence and engagement levels:
Monetizable Daily Active Users
237.8 million: This figure represents the number of monetizable daily active users on X, showing a positive trend with more than 57% of the platform’s users logging in daily. This number has increased from 229 million in the previous quarter, indicating a solid user base that brands can tap into.
Average Daily Usage
34.1 minutes: Users spend an average of 34.1 minutes per day on X, making it the third most-used social network, only behind Facebook and Instagram. For comparison, Instagram users spend 33.1 minutes daily, while Facebook users spend about 30.9 minutes. This daily usage underscores the platform’s potential for engaging with audiences.
Website Visits
6.2 billion: In December 2023, the X website recorded 6.2 billion visits, a growth from 5.9 billion the previous month. This uptick indicates that more users are actively seeking content on the platform, reinforcing its relevance.
Engagement Rate
0.029%: The median engagement rate across all industries on X has declined by 20%, now standing at 0.029%. While this decrease is concerning, it highlights the need for brands to develop more engaging and relevant content to capture user interest.
Tweet Frequency
3.31 Tweets per week: The median frequency of tweets from brand accounts has dropped by 15% compared to the previous year. This reduction suggests that brands may be reassessing their content strategies in light of changing user engagement patterns.
Content Preferences
53% of users: A significant portion of users, 53%, rely on X as a primary source for news. This statistic emphasizes the platform’s role in driving conversations around trending topics and current events.
55% prefer informative content: Informative content remains the most popular type, with 55% of users favoring it. Brands that create relevant, engaging, and timely content are more likely to resonate with their audience and gain traction.
Trending Conversations
Despite the decline in engagement rates and tweet frequency, X remains pivotal for initiating conversations around trending topics. Brands that actively participate in these discussions can enhance their visibility and community engagement.
The usage statistics for Twitter (X) demonstrate that while the platform faces challenges with engagement rates and tweet frequency, its substantial user base and daily activity present valuable opportunities for brands. By understanding user preferences and leveraging the platform’s strengths in news dissemination and trending conversations, businesses can effectively engage their target audience and foster community growth.
Twitter User Demographics 2024
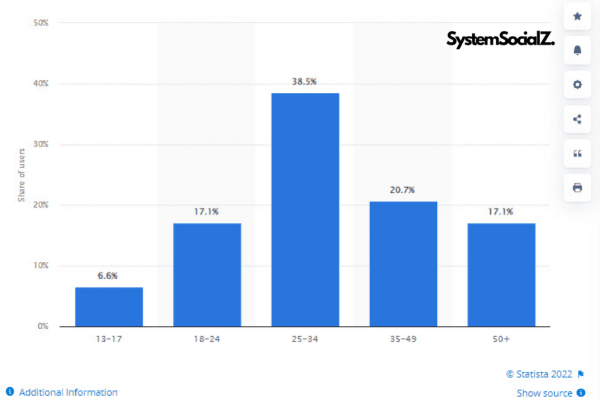
Understanding the demographics and behaviors of Twitter (now X) users is essential for brands looking to engage effectively on the platform. Here are the key statistics that shed light on user profiles and preferences:
Gender Distribution
60% Male | 40% Female: The user base is predominantly male, with a significant number of male users actively reaching out to brands. A study by Khoros indicates that 81% of male users have interacted with a brand on X, compared to 68% of female users. This gender dynamic can influence marketing strategies and messaging.
Age Distribution
36.6% between 25 and 35 years old: X is particularly popular among Millennials, making this age group a prime target for marketing efforts. Conversely, usage among teenagers is relatively low, indicating a shift in the platform’s demographic focus.
Geographic Distribution
Top Locations: The leading countries for X usage include the United States, Japan, and India. Marketers should tailor content to resonate with users in these regions, considering cultural nuances and preferences.
Cross-Platform Usage
Users on X are also active on Instagram, LinkedIn, and Facebook. This interconnectedness suggests that cross-promotional strategies can enhance audience engagement across platforms.
Education Level and Income
29% of users are college graduates: X attracts a highly educated audience, with approximately 49% of users earning more than $70,000 annually and 29% making over $100,000. These statistics highlight the platform’s appeal to professionals and affluent individuals, making it a prime space for B2B marketing and luxury brands.
Community Dynamics
Top Community: Suburban (26%): Suburban users are the largest demographic group on X, closely followed by urban users at 25%. Understanding these community dynamics can inform localized marketing efforts.
Sentiment Trends
33% have a favorable impression: While sentiment towards X has fluctuated, 33% of U.S. adults maintain a positive view of the platform. Notably, 40% of users indicate they are likely to continue using X in the coming year. This reflects a resilience among the user base despite challenges.
Reactions to Changes
Logo Rebranding: The introduction of the new logo was met with mixed reactions, as 33.57% of users reported a neutral stance on the rebranding. However, one-quarter expressed positive feelings, indicating some acceptance of change among users.
These Twitter (X) user statistics provide valuable insights for brands aiming to connect with their audience. By understanding the demographics, engagement patterns, and sentiment trends, marketers can craft targeted strategies that resonate with users. As X continues to evolve, staying informed about its user base will be crucial for effective engagement.
Twitter Usage Statistics by Monthly and Daily 2024
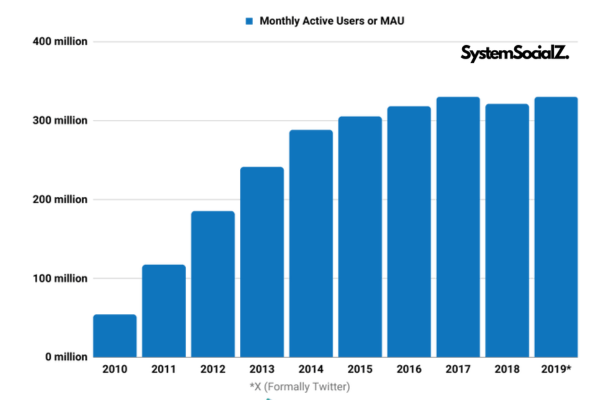
Understanding Twitter’s user metrics is crucial for gauging the platform’s reach and engagement. Below, we break down the current statistics related to monthly and daily active users, as well as the overall growth trajectory of Twitter’s user base.
Twitter Monthly Active Users
As of October 2024, Twitter (now X) has experienced notable fluctuations in its monthly active user base. According to various sources, including statements from Elon Musk, the platform has reported approximately 600 million monthly active users worldwide. In contrast, Linda Yaccarino, the CEO of X, indicated a more conservative figure of over 500 million monthly active users.
Additionally, there are claims of 50.5 million users accessing the platform on a monthly basis, demonstrating varying estimates in the data reported by different stakeholders.
Twitter Daily Active Users
Daily active users (DAUs) represent the number of unique users engaging with the platform within a 24-hour period. Post-acquisition, Twitter has focused on monetizable daily active users (mDAU), which include logged-in accounts capable of receiving advertisements. Recent data estimates that X has around 245 million daily active users globally.
Twitter (X) User Growth
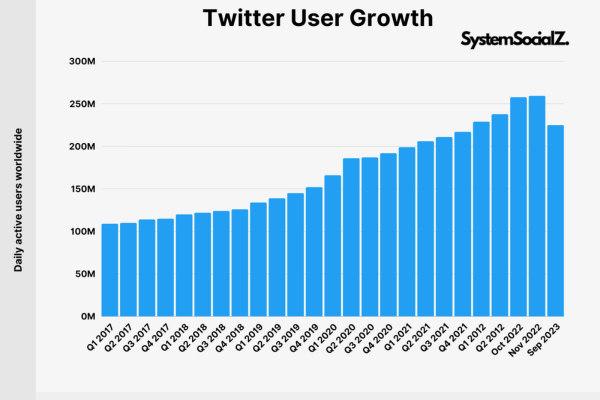
Twitter’s user growth has shown substantial milestones since 2017, although recent data is limited due to the company’s transition to a private entity. The daily active user count has evolved as follows:
- 2017: Started with 109 million DAUs in Q1 and reached 115 million by Q4.
- 2018: Grew from 120 million in Q1 to 126 million by Q4.
- 2019: Saw an increase to 152 million DAUs by the end of Q4.
- 2020: Rapid growth continued, peaking at 192 million in Q4.
- 2021: Increased further to 229 million by Q1 and reached 217 million by Q4.
- 2022: The figures showed a spike to 257.8 million by October and 259.4 million by November.
However, in September 2023, revisions indicated a drop to 225 million, later adjusted to 245 million, showcasing a complex growth narrative influenced by recent corporate changes and market conditions.
This summary provides a focused and accurate account of Twitter’s usage statistics, offering readers insights into the platform’s performance and growth trends. If you have any further adjustments or additional requests, feel free to let me know!
Twitter (X) Statistics for Marketing

For brands looking to leverage Twitter, focusing on visual content and engaging with the user community will be essential to achieving success.
Ad Revenue and Engagement Trends
Annual Ad Revenue: In 2023, Twitter (X) is projected to generate $2.98 billion in ad revenue, reflecting a significant decline of 27.9% compared to the previous year. This decline is attributed to a drop in monthly active users and overall market uncertainty.
Ad Engagement Growth: Despite the revenue decline, there was a 7% increase in ad engagement from 2021 to 2022, indicating that users are still interacting with ads on the platform.
Cost of Advertising:
- Cost per Engagement: Increased by 10% from 2021 to 2022.
- Average Cost per First Action: Ranges from $0.26 to $0.50.
- Average Cost per Follow: Ranges from $1.01 to $2.00.
Unique Advertising Opportunities
Cannabis Advertising: Twitter (X) is notable for being the only major social platform that permits cannabis advertising, making it a unique channel for brands in this industry.
Vertical Video Ads: This ad format sees a 7x higher engagement rate compared to traditional home timeline ads and provides a 10% incremental increase in reach with 14% lower CPM.
User Engagement and Advertising Impact
Engagement Rates: X ads experienced a 22% increase in total engagements in 2023, attributed to changes in algorithms that favor higher interaction.
User Focus on Visuals: A significant 97% of X users are more attentive to the visual elements of ads, emphasizing the importance of incorporating compelling graphics and videos in ad campaigns.
Brand Interaction:
- 81% of male users and 68% of female users have reached out to brands on the platform.
- 66% of brands use X as part of their social media marketing campaigns.
- 30% of brands report that X drives value for their business.
Challenges and Market Dynamics
Declining Engagement Rates: Overall engagement rates on the platform have declined by 20% in the past year, with weekly posts by brands decreasing by 15%.
Competition: While industries like media and retail account for over 52% of Twitter’s ad spending, sectors such as travel and automotive may face less competition, providing an opportunity for brands to stand out.
Future Projections
Long-term Revenue Expectations: By 2027, global advertising revenue on X is expected to drop to around $2.7 billion, highlighting ongoing challenges in maintaining user engagement and advertiser interest.
While Twitter (X) presents unique advertising opportunities and some growth in user engagement, challenges like declining ad revenue and engagement rates require advertisers to adapt their strategies effectively.
Twitter (X) Statistics Businesses Need to Inform Their Strategy
Optimal Posting Times
Best Times to Post: To maximize engagement, businesses should aim to post on:
- Mondays and Fridays: 10 a.m. to noon
- Tuesdays through Thursdays: 9 a.m. to 3 p.m.
Finding the ideal posting time may vary by industry, so businesses should analyze their specific audience’s activity patterns.
Engagement Metrics
Posting Frequency: Top brands on Twitter average about 3.75 posts per week, suggesting a consistent yet manageable posting strategy is effective for audience engagement.
Engagement Rate: The average engagement rate for leading brands is approximately 0.102%. This metric serves as a benchmark for businesses to gauge their own engagement success.
Enhancing Discoverability and Engagement
Use of Emojis: Tweets with emojis stand out more, with 26.7% of all tweets now including them. Incorporating emojis can help improve visibility and engagement.
Discoverability Leader: Twitter is the top platform for discoverability, with users being twice as likely to make in-app purchases and 36% more likely to be early adopters of new products.
User Engagement Behavior
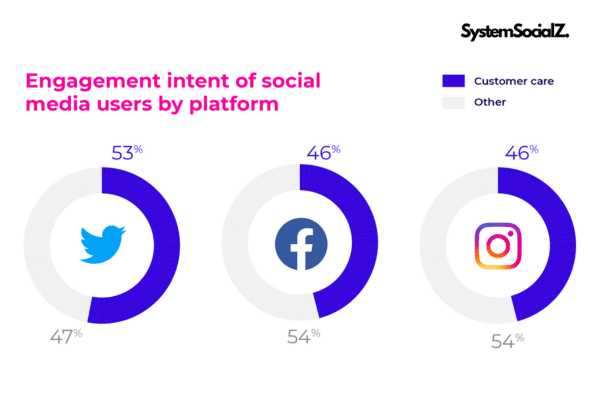
Brand Interaction: 75% of Twitter users have interacted with a brand on the platform. The primary reason for engagement is customer care, with 53% of users reaching out for assistance.
Preference for Messaging: 64% of users prefer sending a message to brands rather than making a phone call, highlighting the importance of being responsive on the platform.
Response Expectations
Expected Response Time: A significant 50% of users expect a response within three hours of their inquiry, whether public or private. Meeting this expectation can enhance brand loyalty, with 45% of users becoming more receptive to a brand’s advertisements after timely responses.
Impact of Positive Experiences: A positive customer service experience on Twitter can significantly influence purchasing decisions, with one-third of users indicating they would buy a product following a satisfactory interaction.
Strategic Takeaways
For businesses aiming to leverage Twitter effectively:
- Align Posting Times: Focus on posting during peak hours to capture audience attention.
- Maintain Consistent Posting: Aim for a frequency that keeps the audience engaged without overwhelming them.
- Incorporate Visual Elements: Utilize emojis and engaging visuals to enhance tweet visibility and interaction.
- Prioritize Customer Care: Be proactive in addressing customer inquiries and complaints, aiming to respond swiftly to foster loyalty.
- Monitor Engagement Metrics: Regularly analyze engagement rates and adjust strategies to optimize performance.
By understanding these statistics and aligning marketing efforts with user behavior, businesses can enhance their presence and effectiveness on Twitter (X).
X (Twitter) Tweet Statistics
Understanding the unique tweeting landscape on X (formerly Twitter) is crucial for businesses and marketers aiming to enhance their social media strategy. Here are some key statistics about tweeting on the platform:
Posting Limits
Users can post up to 2,400 times per day on X, which allows for extensive engagement opportunities. However, this limit helps mitigate bot activity and spam, ensuring that users focus on meaningful interactions.
Top Conversation Topics
In 2023, the four most popular conversation topics on X were sports, gaming, music, and food. Notably, there were over 4 billion posts related to sports alone. Businesses operating within these sectors can benefit from implementing a social listening strategy to tap into relevant discussions and engage with their audience effectively.
Engagement Dynamics
A significant 84% of posts on X consist of replies, retweets, or quote tweets, while only 15% are original tweets. This indicates that users are highly inclined to share content that resonates with them. Marketers should create posts designed for engagement and sharing, as this approach can amplify their reach and visibility on the platform.
By leveraging these insights, businesses can optimize their content strategy on X, engage more effectively with their audience, and enhance their overall social media presence.
X (Twitter) Public Opinion Statistics
The public perception of X (formerly Twitter) has shifted since Elon Musk’s acquisition and the subsequent rebranding of the platform. Here are some key statistics that reflect user sentiment:
User Breaks from the Platform
69% of female users have reported taking a break from using X for several weeks or more in the past year.
54% of male users have also indicated similar breaks. This trend suggests a significant portion of the user base is reassessing their engagement with the platform.
Future Engagement Intentions
40% of users believe it is extremely or very likely they will continue using X in a year.
35% of users feel somewhat likely to remain active on the platform.
Conversely, 25% of users are not likely to use X in the coming year. This highlights a concerning trend of potential user attrition.
User Impressions
Among adults in the U.S. 18% have a very unfavorable impression of X, contrasting with those who hold a favorable view of the platform. This indicates a significant divide in public perception, which may impact user retention and engagement.
These statistics underscore a growing skepticism and varying levels of commitment among X’s user base. Understanding these sentiments can help businesses and marketers strategize more effectively in their communications and engagements on the platform.
Twitter Users by Country
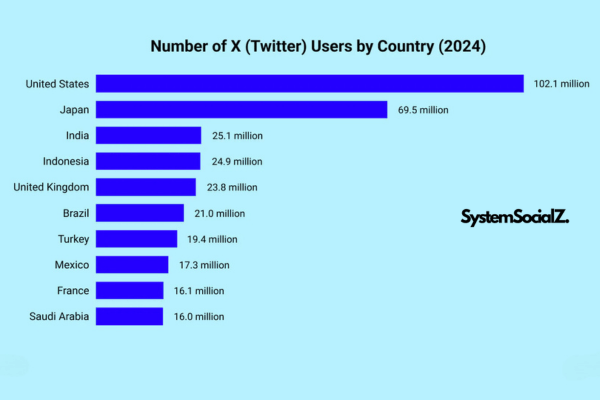
Here’s an overview of Twitter users by country, focusing on the UK, Canada,… and trends post-Elon Musk acquisition as well as projections for 2024:
United Kingdom
Active Users: As of 2024, the number of active Twitter users in the UK is estimated to be around 18 million.
Demographics: The platform sees a diverse demographic, with a notable presence of younger users aged 18-29, followed by those aged 30-49.
Usage Patterns: Users in the UK primarily engage with Twitter for news, entertainment, and social interaction.
Canada
Active Users: Canada has approximately 6.5 million active Twitter users as of early 2024.
Demographics: Similar to the UK, younger audiences dominate the user base, with a significant proportion of users engaging in discussions about politics, sports, and social issues.
Engagement: Canadian users are known for high engagement rates, with many using the platform for customer service interactions with brands.
United States
Active Users: The U.S. remains the largest market for Twitter, with around 77 million active users.
Demographics: A diverse user base, with strong engagement among users aged 18-29 and 30-49.
Usage Patterns: Users engage heavily with news, political content, and brand interactions.
India
Active Users: Approximately 24 million users in India as of early 2024.
Demographics: The platform sees significant use among younger audiences, particularly those interested in politics, sports, and entertainment.
Engagement: Twitter is a vital platform for public discourse and real-time news sharing..
Germany
Active Users: Approximately 10 million active users in Germany.
Demographics: The user base consists of a broad range of ages, with a focus on news, technology, and cultural discussions.
Engagement: German users utilize Twitter for both personal expression and as a platform for social commentary.
France
Active Users: France has around 8 million active users.
Demographics: The platform attracts a diverse demographic, with significant engagement in discussions about culture, politics, and societal issues.
Trends: Twitter is often used to organize and discuss events and movements within the country.
Australia
Active Users: Approximately 6 million active users in Australia.
Demographics: The platform is popular among young adults, with strong engagement in sports, entertainment, and social issues.
Usage Patterns: Twitter serves as a platform for real-time updates and discussions around local and international events.
Post-Elon Musk Acquisition Trends
User Growth: After Elon Musk’s acquisition in late 2022, there was a notable fluctuation in user growth, with initial declines followed by a stabilization phase. Reports indicate a return to pre-acquisition levels, driven by new features and content strategies.
Engagement: Engagement rates have reportedly varied, with spikes in user activity around trending topics like sports and politics, suggesting users are still actively engaging with content despite some dissatisfaction with platform changes.
Public Sentiment: Surveys indicate mixed feelings among users. While some appreciate the new direction, others have expressed concerns about content moderation and platform safety.
2024 Projections
User Estimates: Twitter (X) is projected to reach 700 million monthly active users globally by the end of 2024, with a significant portion from English-speaking countries.
Engagement Strategies: Brands are encouraged to refine their strategies based on user behavior data, focusing on timely content and customer engagement to enhance their presence on the platform.
By leveraging this data, brands can tailor their Twitter marketing strategies to better engage their audiences in specific regions, especially in markets like the UK and Canada.
How Popular Is Twitter (X) Compared to Other Social Networks?
Twitter (X) holds a unique position in the social media landscape, with its popularity varying based on user demographics, geographic regions, and specific use cases. Here’s a comparison of Twitter’s popularity relative to other major social networks as of 2024:
User Base and Active Users
Twitter (X): Approximately 500 million monthly active users (MAUs).
Facebook: Over 2.9 billion MAUs, maintaining its status as the largest social network.
Instagram: Around 2 billion MAUs, popular for visual content and stories.
TikTok: Approximately 1.2 billion MAUs, rapidly growing, especially among younger audiences.
LinkedIn: About 950 million MAUs, primarily used for professional networking.
Engagement Rates
Twitter: Engagement rates have fluctuated, but recent trends show about 0.029% average engagement across industries. The platform is known for its fast-paced, real-time interactions.
Facebook: Average engagement rates are around 0.09%, primarily driven by visual content and community interactions.
Instagram: Higher engagement rates, typically around 1.22%, due to its focus on visual storytelling.
TikTok: Boasts some of the highest engagement rates, often exceeding 5%, fueled by its algorithm-driven content discovery.
LinkedIn: Engagement rates are lower, around 0.39%, but it attracts a highly targeted professional audience.
Demographics and Audience
Twitter: Popular among younger adults (18-29 age group) and users interested in news, politics, and real-time discussions.
Facebook: Appeals to a broader demographic, including older adults, making it the most diverse platform.
Instagram: Primarily attracts younger users (18-34 age group) who prefer visual content.
TikTok: Dominated by Gen Z and younger millennials, focusing heavily on short-form video content.
LinkedIn: Primarily used by professionals, job seekers, and companies, focusing on B2B networking and career development.
Content Format and Usage
Twitter: Text-based posts, hashtags for trending topics, and real-time conversations. It’s widely used for news dissemination, customer service, and social commentary.
Facebook: A mix of text, images, videos, and events. Used for social interactions, community building, and brand marketing.
Instagram: Image and video-centric, with features like Stories and Reels. Focuses on lifestyle, fashion, and personal branding.
TikTok: Short videos, often set to music, focusing on entertainment and trends.
LinkedIn: Professional articles, job postings, and networking opportunities, targeting businesses and professionals.
Market Trends
Growth: Twitter’s growth has slowed compared to TikTok and Instagram, which are rapidly expanding their user bases.
Challenges: Twitter faces challenges such as declining user engagement and competition from platforms like TikTok, which appeals to the same demographic interested in real-time content.
While Twitter (X) remains a significant player in the social media landscape, it competes with larger platforms like Facebook and Instagram in terms of user numbers and engagement rates. Its strength lies in real-time communication and its role as a news and discussion platform. For businesses, understanding these dynamics is crucial for crafting effective social media strategies.
Top Twitter (X) Accounts by Follower Count
With over 500 million users, amassing a significant following on Twitter is no small feat. However, a select group of political leaders, celebrities, entrepreneurs, and brands have managed to exceed 50 million followers. Here’s a look at the top 15 accounts with the highest follower counts on the platform:
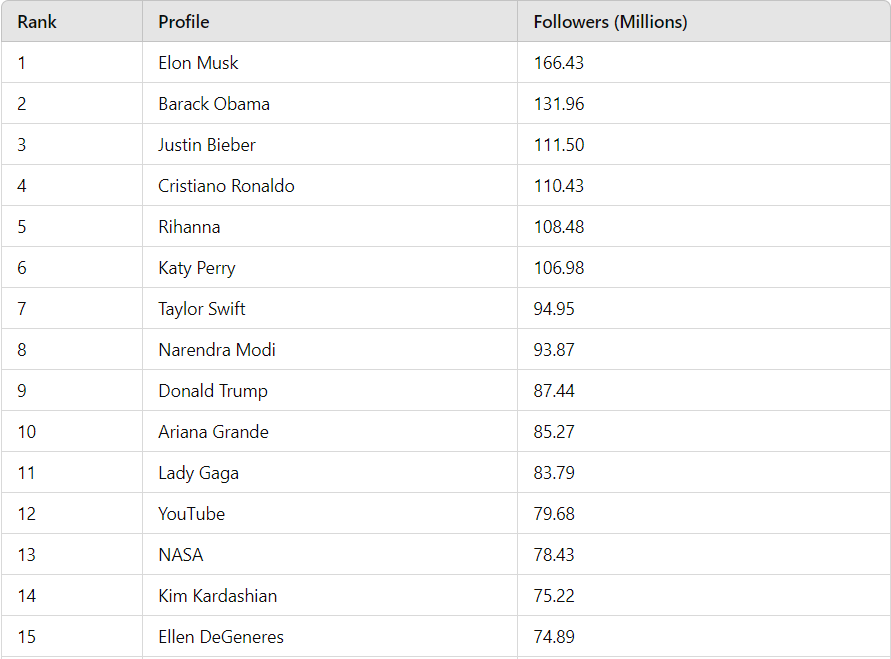
These accounts highlight the diverse range of influencers and entities that dominate the Twitter landscape, showcasing the platform’s impact across various sectors, including entertainment, politics, and science.
Why People Use Twitter?
People use Twitter for various reasons, including:
- Real-time updates: Twitter serves as a platform for breaking news and live event coverage.
- Engagement: Users engage in conversations with brands, public figures, and friends.
- Networking: It’s a tool for professional networking, connecting with peers and industry leaders.
- Entertainment: Users follow celebrities, influencers, and content creators for entertainment.
- Information sharing: Twitter allows users to share opinions, thoughts, and media quickly.
Overview of Twitter’s Usage and Financials
This section delves into key insights regarding user engagement, financial performance, and operational metrics of Twitter.
Time Spent on Twitter per Day
On average, users spend about 30-40 minutes per day on Twitter. This can vary widely depending on the individual’s usage habits and the frequency of checking the app.
Twitter by the Money
Twitter primarily generates revenue through advertising. It offers various ad formats, including promoted tweets, accounts, and trends. Additionally, Twitter has explored subscription services (like Twitter Blue) to diversify its revenue sources.
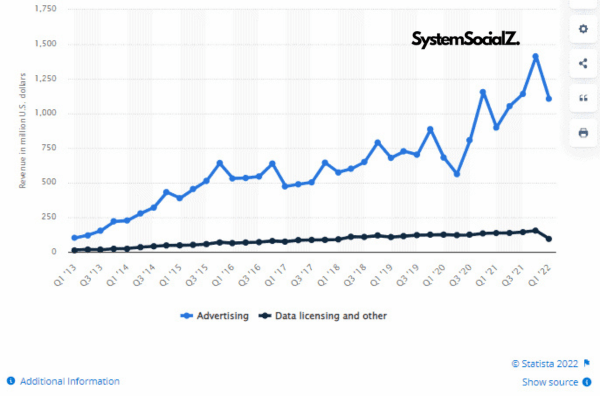
Twitter Revenue by Year
Twitter’s revenue has fluctuated over the years. Here’s a simplified overview:
- 2019: $3.46 billion
- 2020: $3.72 billion
- 2021: $5.08 billion
- 2022: $4.5 billion (estimation post-Elon Musk acquisition)
- 2023: Projected to be around $2.98 billion, reflecting a decline.
How Many Employees Does Twitter Have?
As of 2024, Twitter has approximately 1,500 to 2,000 employees, down from a peak of about 7,500 before Elon Musk’s acquisition, due to significant layoffs and restructuring.
Twitter Revenue
The bulk of Twitter’s revenue comes from advertising, accounting for about 75% of its total income. The remaining revenue comes from data licensing and subscription services.
By examining key metrics such as daily time spent on the platform, revenue trends, employee count, and financial performance across various segments and regions, businesses and marketers can gain valuable insights into Twitter’s operational dynamics and overall significance within the competitive social media landscape.
Understanding Hashtag Analytics on Twitter
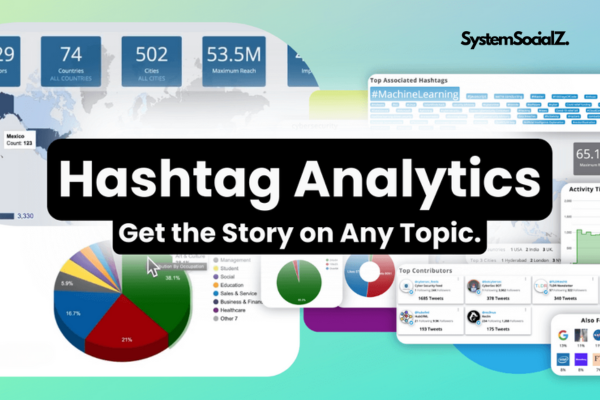
Hashtags are a vital part of Twitter’s ecosystem, enabling users to categorize content and enhance discoverability. Analyzing hashtag performance can provide valuable insights for brands and marketers looking to maximize their impact on the platform. Here are some key aspects of hashtag analytics on Twitter:
Importance of Hashtag Analytics
Increased Visibility: Hashtags help tweets reach a broader audience beyond just followers, making them essential for enhancing visibility and engagement.
Content Categorization: Using relevant hashtags organizes content, helping users find topics of interest and increasing the likelihood of interactions.
Trends Tracking: Hashtags can indicate trending topics and conversations, allowing brands to engage in timely discussions and capitalize on popular trends.
Key Metrics to Track
Engagement Rate: Measure the number of interactions (likes, retweets, replies) your posts with specific hashtags receive. A higher engagement rate indicates effective hashtag use.
Impressions: Track how many times tweets with particular hashtags were displayed to users. This helps assess the reach of your content.
Click-Through Rate (CTR): Analyze how many users clicked on links within tweets that included hashtags, providing insight into the effectiveness of your call-to-action.
Hashtag Volume: Monitor the frequency of specific hashtags over time to identify rising trends or shifts in audience interest.
Tools for Hashtag Analytics
Twitter Analytics: This built-in feature allows users to view tweet performance, including engagement metrics associated with hashtags.
Third-Party Tools: Platforms like Hootsuite, Sprout Social, and Hashtagify provide in-depth analytics, tracking hashtag performance across various metrics and comparing them with competitors.
Best Practices for Using Hashtags
Relevance: Ensure hashtags are relevant to the content and target audience to enhance engagement.
Limit Usage: Use 1-2 hashtags per tweet for optimal engagement, as excessive hashtags can overwhelm users and dilute focus.
Trend Participation: Engage with trending hashtags to join larger conversations and increase visibility.
Hashtag analytics on Twitter is crucial for brands and marketers seeking to refine their social media strategy. By understanding and leveraging hashtag performance, businesses can enhance their content visibility, engage with their audience more effectively, and stay ahead of industry trends. Follow more Twitter Analytics at System Social!
Twitter Statistics – Frequently Asked Questions

Here’s a breakdown of your questions regarding X (formerly Twitter), covering how to access statistics, demographic insights, and strategies for marketing:
How to check follower stats on Twitter?
Profile Page: Simply go to your profile page to see your total follower count displayed at the top.
Twitter Analytics: For deeper insights, use the Twitter Analytics page, which provides demographic information about your followers, their interests, and engagement rates.
What are the demographics of X in 2024?
While specific 2024 data is still emerging, general trends indicate:
Age Groups: X continues to attract younger audiences, especially users aged 18-29, although it also has significant user segments aged 30-49 and 50+.
Gender: The platform has a relatively balanced gender distribution, with a slight majority of male users.
Geographical Spread: X is popular in North America, Europe, and parts of Asia, with notable user bases in countries like the United States, Japan, and the UK.
Is X still relevant?
Yes, X remains relevant, especially for real-time news, social discussions, and brand engagement. Despite challenges since Elon Musk’s acquisition, many users still rely on the platform for updates and community interactions.
What do people talk about on X?
Discussions on X cover a wide range of topics, including:
- Current Events: News and updates in politics, sports, and entertainment.
- Pop Culture: Trends in music, movies, and celebrity news.
- Brand Engagement: Customers often use X for customer service, feedback, and brand discussions.
How do I develop a marketing strategy on X?
To develop a marketing strategy on X, consider the following steps:
- Define Objectives: Determine your goals, whether increasing brand awareness, driving traffic, or enhancing engagement.
- Know Your Audience: Understand who your target audience is and what they want from your brand on X.
- Content Strategy: Create a mix of engaging content, including tweets, images, videos, and polls. Use hashtags wisely to boost visibility.
- Engagement Plan: Develop a plan for interacting with followers, responding to mentions, and participating in relevant conversations.
- Analyze and Iterate: Regularly review your analytics to see what works and refine your strategy accordingly.
How can an agency help with X marketing?
An agency can assist with X marketing in several ways:
- Expertise: Agencies have experienced teams who understand the nuances of X marketing and can develop effective strategies.
- Content Creation: They can create high-quality, engaging content tailored to your brand and audience.
- Analytics and Reporting: Agencies can monitor your account’s performance and provide insights to inform future campaigns.
- Advertising: They can manage ad campaigns to increase reach and engagement while optimizing for budget and performance.
This guide should help you navigate X and leverage its potential for marketing and engagement!
Conclusion
Understanding Twitter Statistics is crucial for businesses aiming to enhance their online presence and engage effectively with their audience. From user demographics and engagement patterns to the effectiveness of different content types, these metrics provide valuable insights that can shape your marketing strategies. By staying informed about the evolving landscape of Twitter, brands can better connect with their target market, drive engagement, and maximize their return on investment.
At System SocialZ, we specialize in harnessing the power of Twitter and other social media platforms to help brands optimize their marketing efforts. Our expertise in social media analytics allows us to create tailored strategies that not only resonate with audiences but also deliver measurable results. Whether you’re looking to enhance your brand’s visibility or drive engagement through data-driven insights, System SocialZ is here to support your journey in the dynamic world of social media.

